This is the last post in the 6-post series on the Crafty Penguins DevOps Journey we take our clients on. Lastly, we’ll look at the service of Monitoring / Metrics / Alerting (MMA).
Sometimes, in the production environment, no one knows the health status of all the pieces and what can be seen in production. And, oftentimes it’s hard to debug problems that occur on the fly (we usually take the “reboot and pray” approach to solving problems). For us, solid MMA means 4 things:
- Setting up proper feedback through all previous journey markers to ensure high functionality;
- Quick and simple visibility into the issues;
- Statistics to validate performance improvements and show unexpected hindrances (i.e. did recent code insertions make things faster or slower?); and
- Ensuring proper feedback to dynamic scaling systems in order to reduce costs
For other posts we’ve written on this topic, see:
- Why we love Prometheus and Grafana
- Optimizing Grafana and Prometheus rendering performance using Trickster
Well, there you have it: the Crafty Penguins DevOps Journey! Do you feel the pain we’ve described? If you do, we have solutions ready to relieve that pain. You can schedule a call, call us, or send a message on our contact page. We look forward to hearing from you!
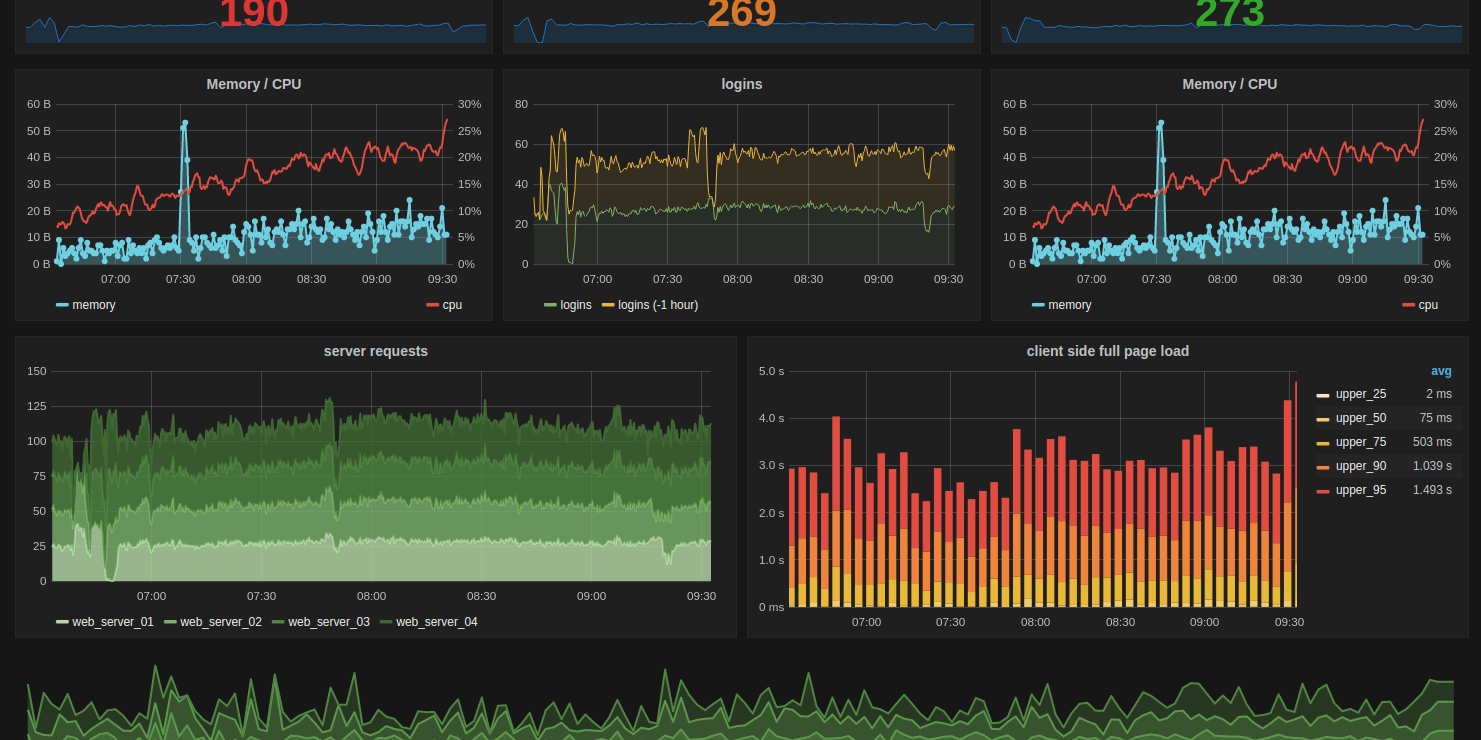
Image source: https://commons.wikimedia.org/wiki/File:Grafana_dashboard.png

Author: Slava Martin
The Crafty Penguins team provides Linux, DevOps, and SRE tools and services for leading edge technology companies around the world.