Grafana has a lot of cool built-in drivers for connecting and running SQL against databases. You can see at a glance literally anything you can think of. Do you want a dashboard showing users who are active in a table? Do you want to see how often they’ve logged in? Or how many tickets you have open at a time? Grafana can do all of this, provided your SQL-foo is up to the task.
But, it lacks one thing; time series data. What if you wanted to see how many users you have logged in, graphed over a week? What if you want to check what that metric was half a year ago? These are things that Grafana alone cannot tell you since that data is generally not stored within the SQL data. The solution to this problem is Prometheus and exporters. Grafana can be told to scrape from a Prometheus time-series database, which is a great open source project (written in Golang!) with a ton of utilities that we use extensively (Read here to find out more about Prometheus). Prometheus will be the data store for our SQL metrics and grab-data from an exporter.
Now, instead of defining SQL in Grafana, we can define it using this handy program called sql_exporter. Grafana can reference simple variable names using the Prometheus query language, and Prometheus/SQL Exporter can do the heavy lifting with data handling. The only downside is that we can’t have historical data for non-numeric stuff, but that’s a whole other story.
We use this heavily ourselves, as we show various metrics from a Microsoft SQL Server database (used by ConnectWise Manage) on Grafana-based LCD Dashboards around the office.
If you want to read more about things related to Grafana and SQL, check out these links:
- http://docs.grafana.org/features/datasources/mysql/
- http://docs.grafana.org/features/datasources/prometheus/
- https://github.com/prometheus/prometheus
- https://github.com/free/sql_exporter
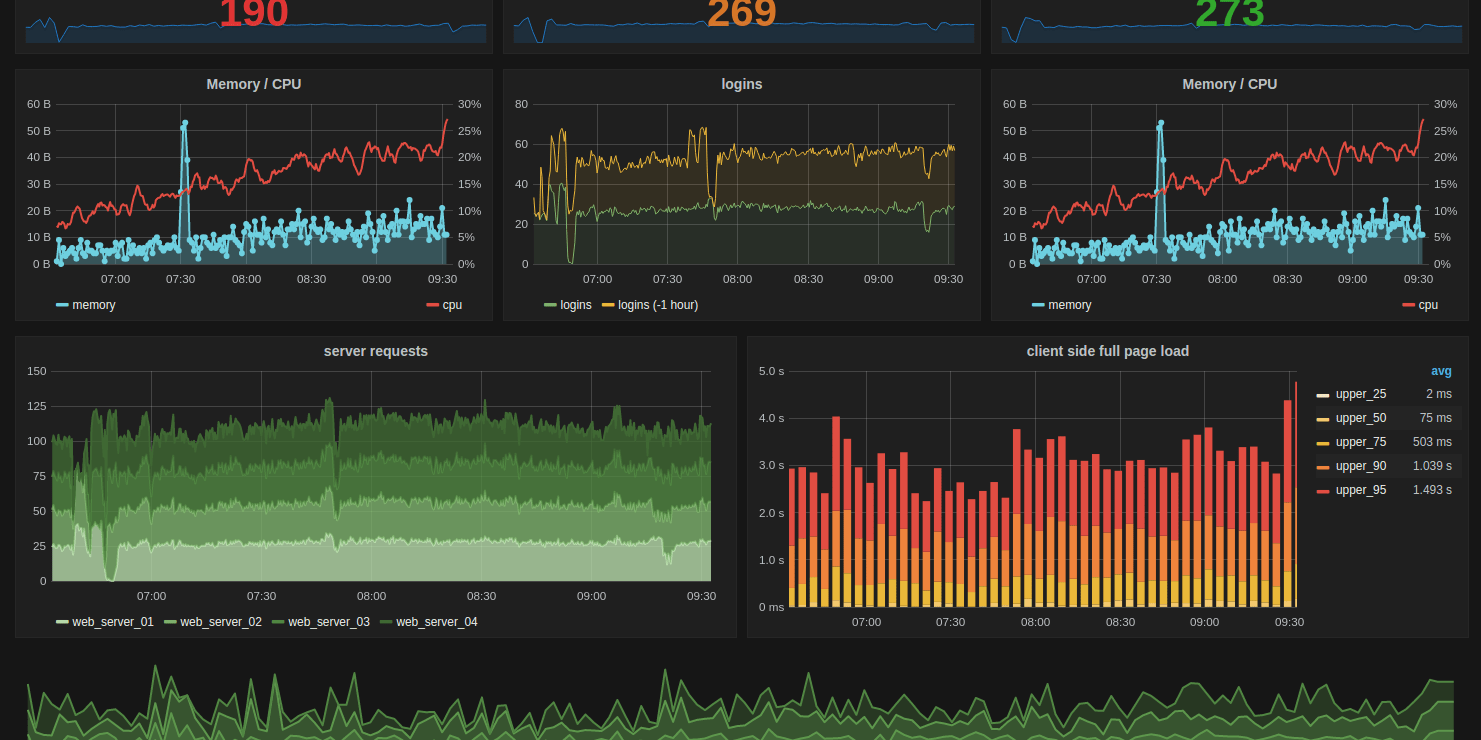
Image source: https://commons.wikimedia.org/wiki/File:Grafana_dashboard.png

Author: Nicole Macfarlane
Linux Engineer