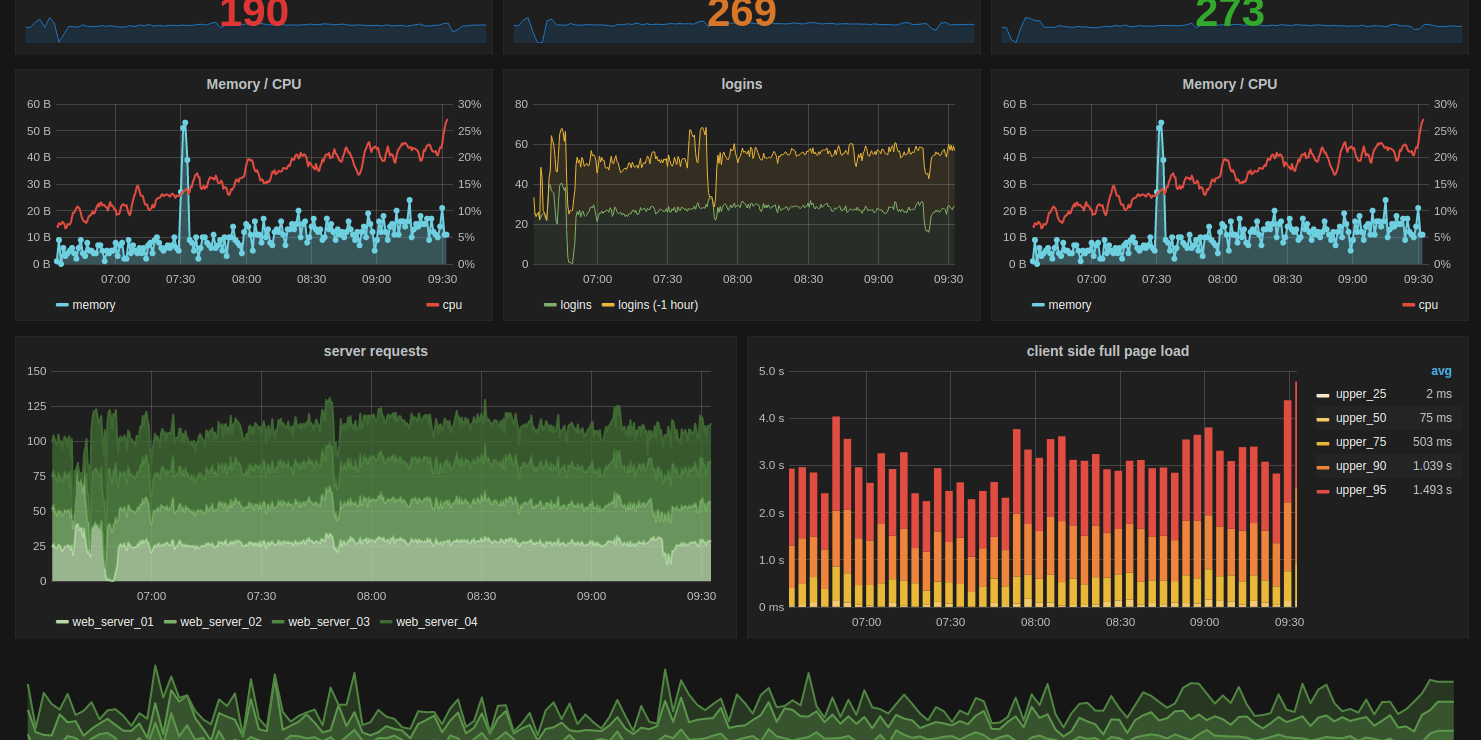
I came across this recent blog post on OpenSource.com about the Top 10 Grafana Features. We too love Grafana of course (blog post). it’s amazing that for a project that’s under 7 years old already has over a 1/2 million installations!
Here are the top features of Grafana that we use ourselves, or help our customers implement:
- Dashboard templating: This lets us create reusable dashboards. For example, we can have a dashboard about a particular business unit, or customer, or a server. With a simple drop-down selection on the top, that customer/server/etc name can be switched and all the graphs on that dashboard are updated. They can also be dynamic, based on SQL data for example.
- Provisioning: In some cases, we automate the dashboard setup using scripts. This lets us easily setup new Grafana dashboard servers without manually creating all the dashboards manually.
- Kiosk mode and playlists: We have multiple LCD monitors in our office, that show graphs in the so-called “Kiosk” mode and sometimes as a rotating playlist. Stop by and check it out or see if you can spot them in our open house pictures on our blog, LinkedIn or Google Map profile!
- SQL data sources: We graph many business metrics (Sales, marketing, revenue, invoicing, etc) using a SQL data source from our Connectwise system.
- Custom plugins: We have written custom plugins for Prometheus to extract data from external systems, which Grafana may not support natively.
You know who to go to if you need help with Grafana or Prometheus

Author: Wim Kerkhoff
CEO